Bitcoin, the original crypto king, is back in the spotlight. Over the past few days, its price has been dancing around the $60,000-$61,000 mark, leaving traders wondering: Is this the start of a breakout, or are we headed for another short-term dip? Let’s dive into the charts, indicators, and market sentiment to understand where BTC might be heading next.
Price Action Analysis
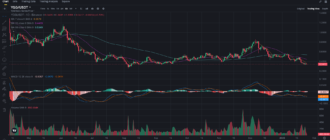
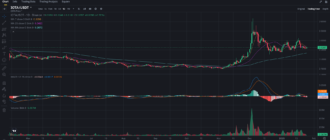
Looking at the 1-hour BTC chart, we can see a steady upward movement, with Bitcoin recently bouncing off the $60,000 support level. The Moving Averages (MA) offer a clear picture: the 7-period Simple Moving Average (SMA) is acting as short-term support, hovering around $60,956, while the 25-period SMA sits slightly above it at $60,878. Both are trending upward, indicating some bullish momentum in the short term.
The 99-period SMA, however, is still far off at $62,087, acting as a significant resistance. This level aligns closely with the last swing high, which tells us that Bitcoin needs to clear this area before we can expect any sustained push towards the $65,000 level.

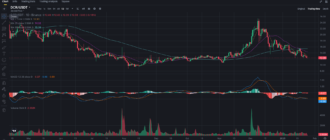
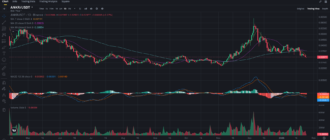
Moving to the 4-hour chart, the broader trend paints a different picture. BTC has faced consistent selling pressure near the $63,000 mark, with the 99-SMA now acting as a clear resistance at $63,209. The 25-period SMA, currently around $62,021, has also proven difficult to break. The price has yet to build enough momentum to cross these key levels, suggesting that Bitcoin may still struggle to gather strength for a full-fledged rally.
MACD Signals – Are the Bulls Ready?
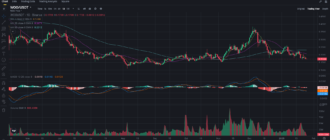
The MACD (Moving Average Convergence Divergence) indicator on both the 1-hour and 4-hour charts shows some conflicting signals. On the 1-hour chart, the MACD line has crossed above the signal line, suggesting the potential for a bullish reversal. The histogram shows positive momentum with increasing green bars, reinforcing the idea of short-term price growth.
However, the 4-hour MACD remains bearish overall. While we’ve seen some recovery in the MACD line (currently at 78.88) after a dip, the momentum is still fragile. With the signal line trailing behind at -819.40, this divergence indicates that bulls are yet to take full control of the larger timeframe. This tells us that while short-term traders may find opportunities to capitalize on smaller movements, the long-term trend still faces uncertainty.

Support and Resistance Zones
For now, $60,000 remains the critical support level. If Bitcoin closes below this level on the daily chart, we could see a further pullback toward $58,000. On the upside, resistance sits firmly between $62,000 and $63,200. A strong break above these levels could push BTC to test the $65,000 mark, which has historically been a psychologically significant level for traders.
Recent Market Sentiment and News
Recent crypto news hasn’t been as explosive as in past bull runs, but several key developments have kept traders engaged. For one, Bitcoin’s dominance over the altcoin market remains strong, signaling a potential shift in capital back to safer, established assets as market uncertainty looms. Meanwhile, macroeconomic factors such as rising interest rates and growing concerns over inflation could further fuel Bitcoin’s appeal as a store of value.
Binance, one of the largest cryptocurrency exchanges, has also seen a surge in BTC trading volumes, reflecting growing interest. This uptick in volume could signal institutional accumulation, a bullish indicator for Bitcoin’s long-term prospects.
Short-Term vs. Long-Term Outlook: What Should Traders Do?
For Short-Term Traders:
If you’re a short-term trader, there are clear opportunities ahead. The current bounce from the $60,000 support level offers a decent entry point. If BTC can break above $62,000, you might want to consider riding the wave up to $63,000 or even $65,000. Keep a close eye on the 1-hour MACD as a leading indicator for this movement. However, if the price fails to break through $62,000, it might be wise to take some profits or close positions and wait for another pullback to the $60,000 level for a better re-entry.
For Long-Term Investors:
For those with a longer horizon, Bitcoin is still a solid bet. With support near $60,000 holding strong and a potential rally toward $65,000 on the horizon, this could be an excellent time to accumulate more BTC, especially if you’re prepared to weather short-term volatility. The long-term fundamentals for Bitcoin haven’t changed; it’s still the leading cryptocurrency, and as macroeconomic uncertainties grow, its appeal as a hedge against inflation only strengthens. Consider buying dips or dollar-cost averaging (DCA) into your positions, particularly if BTC tests the $58,000 level.
Conclusion: Ready for the Next BTC Wave?
Bitcoin’s price movement is at a critical juncture. With support holding steady and short-term momentum building, there’s a real chance that we could see a breakout above the $62,000-$63,000 range. If Bitcoin can break through these resistance levels, the next target of $65,000 becomes a real possibility. However, traders should remain cautious, especially with conflicting signals on the longer-term charts.
For short-term traders, watch for key breaks above resistance and use the 1-hour MACD to time your entries. For long-term investors, now might be a good time to buy the dip and strengthen your position. Either way, the coming days are going to be crucial for Bitcoin’s next major move.
If you want to stay updated on more Bitcoin insights, trade tips, and market analyses, don’t forget to follow me on Binance Square. Join the community of traders and investors at Binance Square for daily updates and analysis. Let’s ride the crypto waves together!


