Banana Gun is a trading-tool project that previously saw explosive price action driven by strong speculative demand and user activity. After a powerful rally, price entered a distribution phase followed by a prolonged decline, reflecting cooling interest and a broader reduction in risk appetite. As 2026 begins, BANANA trades far below its historical highs, making the 2026 price forecast highly dependent on whether the market can exit its deep bearish structure. Current price behavior suggests an attempt to stabilize after heavy selling pressure.
BANANA technical analysis: daily chart and market structure
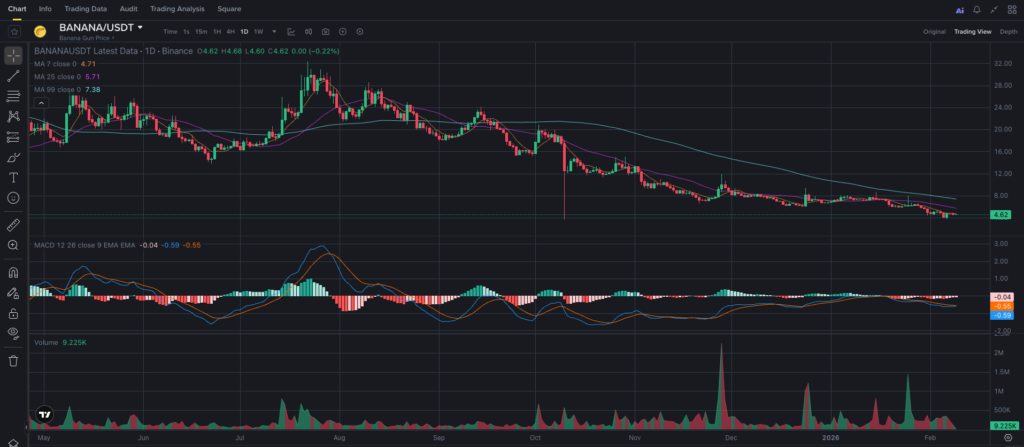
This technical analysis is based on the 1D timeframe. The latest completed candle is February 9, 2026, 02:00 UTC. On the daily chart, BANANA remains locked in a bearish structure defined by lower highs and lower lows, established after the mid-year peak.
Following a strong expansion phase, the market moved into distribution and then experienced a sharp downside impulse in autumn. That move marked a structural break, and price has since failed to reclaim bullish momentum. All subsequent rebounds have been corrective, ending with progressively lower highs.
BANANA support and resistance levels
The primary support zone is located around $4.40–4.60, where price is consolidating at the start of 2026. This area has repeatedly acted as a local demand zone, slowing further declines.
If support fails, the next downside reference lies near $3.50–3.80, an area of prior trading activity. On the upside, immediate resistance appears at $6.00–6.50, followed by a stronger supply zone around $8.00–9.00, where long-term resistance and previous distribution zones converge.
Moving averages and trend condition
The chart uses MA 7, MA 25, and MA 99. Short- and mid-term averages remain below the long-term MA(99), with all slopes pointing downward. This alignment confirms sustained bearish control across multiple time horizons.
Short-term bullish crosses have appeared, but without volume support they faded quickly. A structural shift would require sustained price action above MA(99) and a clear change in its slope.
MACD and volume analysis
MACD remains below the zero line, with the MACD line under the signal line. The histogram shows consistent negative values, although momentum is gradually weakening. This suggests selling pressure is easing, but no confirmed reversal signal is present.
Volume dropped sharply after the autumn sell-off. Recent trading activity remains moderate, with occasional spikes, typical of a market in a waiting phase rather than active accumulation.
Short-term outlook for BANANA
If price holds above the $4.40–4.60 zone, BANANA could enter a sideways consolidation phase with attempts to test $6.00. A decisive breakdown would increase the probability of a move toward $3.50–3.80. As long as price remains below major resistance, upside moves appear technical in nature.
BANANA price prediction for 2026: scenario outlook
The base-case scenario for 2026 places BANANA in a $9–14 range. This outcome becomes more likely if market conditions stabilize, demand for trading tools returns, and price reclaims long-term resistance levels.
A more bullish scenario allows for expansion into the $18–25 zone, contingent on sustained trend reversal, rising volumes, and renewed user engagement.
The bearish alternative scenario envisions continued pressure and price action within $2.80–3.80, should current support fail and broader market sentiment deteriorate.
Additional factors influencing BANANA’s price
Recent market focus has shifted toward demand for trading bots and automation tools. For BANANA, feature updates, user activity, and competition within the segment remain critical variables.
Macro conditions, regulatory developments, and changes in retail trading behavior also influence sentiment. Any catalysts that revive active trading could support price recovery.
Trading vs investing: how participants may approach BANANA
BANANA currently trades within a prolonged downtrend showing signs of deceleration. Volatility has declined, and momentum remains subdued.
Short-term traders often monitor reactions near key support and resistance zones, paying close attention to false breakouts and volume changes.
Long-term investors may view 2026 as a potential recovery horizon, spacing exposure over time while waiting for structural confirmation.
Final thoughts on BANANA in 2026
Banana Gun enters 2026 after a major trend breakdown and an extended decline. While the technical picture remains cautiously bearish, early stabilization signals are emerging. Any recovery will depend on renewed interest in trading tools and broader market conditions. Under supportive scenarios, upside potential exists, though downside risks remain. BANANA is available on major exchanges including Binance, Bybit, and HTX.