Chart Overview and Current Market Context
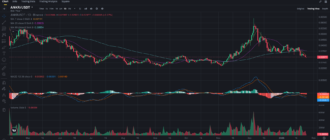
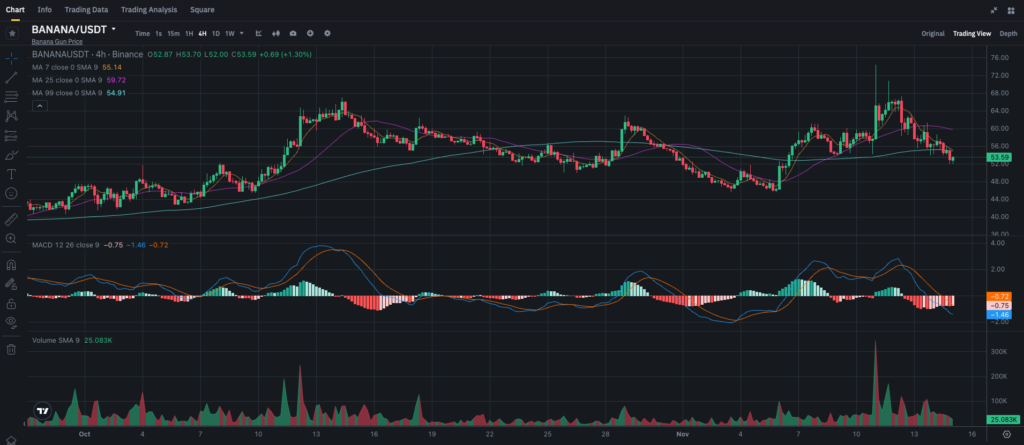
The 4-hour chart for BANANA displays a mix of bullish and bearish phases over recent weeks. The price currently sits around $53.59, after a period of gradual decline following an earlier peak. Key moving averages and indicators suggest that BANANA might be consolidating at this level, with potential for a reversal if certain signals align. Below, we’ll dive into the technical indicators and price levels that could shape BANANA’s near-term trajectory.
Key Support and Resistance Levels
Understanding significant support and resistance levels helps identify possible trading ranges and breakout points:
- Immediate Support: $52 – This level aligns with recent lows, providing immediate support for the current price. If this level holds, it could encourage buyers to step in.
- Major Support: $48 – This is a more substantial support level that has historically held up in previous pullbacks. A drop below $48 would likely signal a bearish continuation.
- Immediate Resistance: $55 – Close to the 7-day moving average, this level could act as the first line of resistance in a potential upward move.
- Major Resistance: $60 – A stronger resistance level that aligns with prior highs. A breakout above $60 would signal renewed bullish momentum and could lead to a more sustained rally.
These levels set up the immediate trading range, with $52 as a key support level and $60 acting as a resistance barrier.
Moving Averages (MA) Analysis
The moving averages provide insights into BANANA’s short-term and medium-term trends.
- 7-day MA (Short-Term): The 7-day moving average is currently around $55, sitting above the price. This indicates short-term bearish pressure, and the price would need to break above this level to build bullish momentum.
- 25-day MA (Medium-Term): Positioned at $59.72, the 25-day moving average represents a medium-term resistance. BANANA’s recent inability to surpass this level suggests that bullish conviction is limited for now.
- 99-day MA (Long-Term): At $54.91, the 99-day MA is close to the current price, making it a significant pivot point. A decisive move above the 99-day MA could suggest the end of the recent downtrend, while failure to hold above this level might lead to further declines.
With the price currently below both the 7-day and 25-day MAs, BANANA is experiencing short-term and medium-term bearish signals. However, its proximity to the 99-day MA makes it a critical point to watch, as it could influence whether the price consolidates or begins a new uptrend.
MACD Analysis
The MACD (Moving Average Convergence Divergence) provides additional insights into BANANA’s momentum and potential trend direction.
- MACD Line: The MACD line is below the Signal line, indicating bearish momentum. This suggests that the recent downtrend may continue unless there’s a reversal in momentum.
- Histogram: The histogram shows a series of red bars, confirming the bearish pressure. However, the bars are starting to decrease in size, which could indicate that selling momentum is weakening and consolidation is taking place.
The MACD confirms a short-term bearish outlook, but the shrinking histogram bars may signal that the downtrend is losing strength, setting the stage for a potential reversal if buying pressure increases.
External Market Factors Impacting BANANA
Broader Market Sentiment and Altcoin Trends
BANANA, like many altcoins, is sensitive to the overall market sentiment. The broader altcoin market has been experiencing mixed trends, with both bullish breakouts and bearish consolidations depending on the token. If the overall market sentiment shifts to favor altcoins, BANANA could benefit from increased buying interest, especially if it breaks above its key resistance levels.
Project-Specific Developments
Any project-specific news or updates from the BANANA team, such as new partnerships, network upgrades, or collaborations, could significantly impact the token’s price. Positive developments could renew interest among investors and encourage a trend reversal. Conversely, a lack of updates might limit the token’s momentum, keeping it within its current range.
Price Forecast and Potential Scenarios
Based on the technical analysis above, BANANA could move in several potential directions in the near term:
- Bullish Scenario: If BANANA breaks above the immediate resistance at $55, it could target $60 as the next level. This scenario would likely require increased trading volume and a bullish crossover on the MACD. A sustained rally above $60 could open the door for further gains.
- Neutral/Consolidation Scenario: If BANANA holds within the $52 to $55 range, it may enter a consolidation phase. This range-bound behavior would indicate indecision among traders, with the market waiting for a clearer signal before making larger moves.
- Bearish Scenario: If the price breaks below the $52 support level, BANANA could fall toward $48. A drop below $48 would indicate a continuation of the bearish trend and could trigger additional selling pressure.
Trading and Investment Insights
For Short-Term Traders
Short-term traders could look for an entry if BANANA breaks above $55 with strong buying volume. In this case, potential profit-taking targets might be around $58 to $60, with a stop-loss slightly below $52 to manage risk. If BANANA fails to break above $55, it might be best for short-term traders to hold off on entering until a clearer trend emerges.
For Long-Term Investors
Long-term investors might consider accumulating BANANA if it holds above the 99-day moving average, currently at $54.91, as this could signal the beginning of a trend reversal. If the price falls toward $48, it might offer a more favorable buying opportunity for investors with a long-term outlook, as this level has historically provided strong support.
Conclusion
BANANA’s current price action shows a mix of short-term bearish and consolidative behavior, with key support at $52 and resistance at $55. The MACD and moving averages suggest that momentum remains limited, but there are signs that the selling pressure could be slowing. BANANA’s direction will likely depend on whether it can break out of its current range, influenced by overall market sentiment and any potential project-specific developments.
BANANA is available for trading on Binance in a USDT pairing, offering ample liquidity for both short-term and long-term traders.

