Audius (AUDIO), the decentralized music streaming protocol, has been making some serious moves on the charts recently. With its price surging and technical indicators pointing to strong momentum, traders and investors are watching closely. So, what does this mean for AUDIO holders and those looking to trade the token? Let’s dive into the details of the current price action, analyze the key levels, and make some informed predictions for where AUDIO could be heading.
Chart Analysis and Market Trends
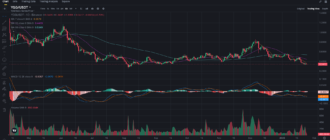
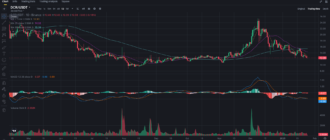
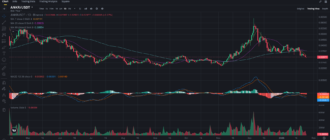
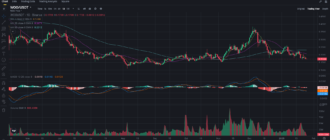
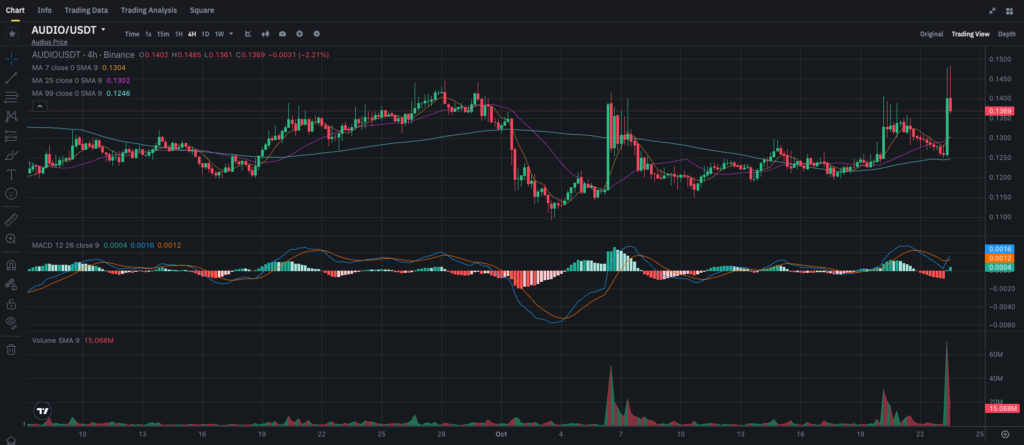
Looking at the 4-hour chart of AUDIO, we can see that the token has experienced a significant breakout. After trading sideways for a few days, AUDIO suddenly spiked, touching a high of $0.145 before pulling back slightly to $0.1369. This sharp movement is supported by a considerable increase in trading volume, which is an important signal of buyer interest.
Several key technical indicators give us clues about the current market sentiment:
Moving Averages
• 7-day Moving Average (MA): Sitting at $0.1304, the price is currently well above this line, indicating strong short-term bullish momentum. When the price stays above this moving average, it often signals a continued uptrend.
• 25-day Moving Average (MA): At $0.1302, this line is also below the current price, providing an additional layer of short-term support.
• 99-day Moving Average (MA): Sitting at $0.1246, this is a crucial long-term support level that has acted as a base in recent weeks. As long as the price stays above this level, the overall trend remains bullish.
MACD Indicator
The MACD (Moving Average Convergence Divergence) has just turned bullish. The MACD line (blue) has crossed above the signal line (orange), and the histogram is printing green bars, confirming the momentum shift. This bullish crossover often precedes upward price movements and strengthens the likelihood of further gains in the short term.
Volume
We can also observe a strong uptick in trading volume, especially during the recent price surge. Volume is one of the most reliable confirmations of a price movement. The spike in volume suggests that more market participants are jumping in, pushing the price higher.
Key Support and Resistance Levels
Understanding the critical levels on the chart helps you make informed trading decisions. Let’s break down the support and resistance points:
Support
• The immediate support is at $0.1304, the level of the 7-day moving average. If the price tests this level and holds, it could act as a solid base for the next upward leg.
• Strong secondary support lies at $0.1246, aligning with the 99-day moving average. This level has historically held up well, and any dip near this point could be an opportunity for accumulation.
Resistance
• The first major resistance lies at $0.145, which is where the price got rejected after its recent spike. A break above this level would likely push the price toward higher targets.
• If AUDIO breaks the $0.145 level, the next resistance zone would be around $0.15, a psychological barrier that could attract even more buyers.
Trading and Investment Recommendations
For Short-Term Traders:
Given the recent breakout and strong momentum indicators, short-term traders have several opportunities:
• Entry Point: Look to enter around $0.136 if the price consolidates above the 7-day moving average. This is a key support level that could act as a base for a further upward move.
• Target Levels: Aim for a short-term target of $0.145, with an extended target of $0.15 if the breakout continues.
• Stop Loss: Place a stop loss just below the 99-day moving average at $0.1246. If the price dips below this level, it might signal a reversal in the current uptrend.
For Long-Term Investors:
For long-term investors looking to accumulate more AUDIO or hold their current position, the current price action offers an excellent opportunity:
• Buy on Dips: Consider buying more if the price dips to the support range of $0.1246 to $0.13. This level has proven to be a strong support zone in the past and offers a favorable risk-reward ratio.
• Hold for Higher Gains: With the recent bullish momentum and strong market interest, AUDIO has the potential to push toward $0.16–$0.18 in the coming weeks, making it a good time to hold for long-term gains.
Price Prediction for Audius (AUDIO)
Based on the analysis of the current chart and the bullish indicators, AUDIO has the potential to break the $0.145 resistance level soon. If this happens, the price could move toward $0.15 in the short term. Further upside could push the price to $0.16, and if the bullish sentiment remains strong, we might see a rally toward $0.18 in the coming weeks.
However, if the price faces rejection at $0.145 again and retraces, the support at $0.1246 will be crucial. A break below this level would signal a deeper correction, and the next support to watch would be around $0.115.
Conclusion: Is AUDIO Ready for the Next Bullish Leg?
Audius is currently showing strong bullish signals on both short-term and long-term charts. The breakout above key moving averages, coupled with the bullish MACD crossover, points to the possibility of further price increases in the near term. For short-term traders, this is an excellent opportunity to ride the upward momentum, while long-term investors can consider accumulating more at support levels.
To stay updated with the latest crypto analysis and trading strategies, follow my blog on Binance Square and join my Telegram community at t.me/hardhodlcom for exclusive insights.


