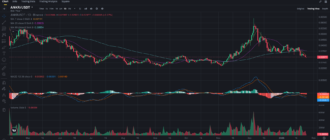
Arbitrum (ARB), a leading Ethereum Layer 2 scaling solution, has experienced a challenging week with a noticeable downtrend. The token has fallen significantly from its recent highs of around $0.64 and is now hovering around the $0.52 range. The market has shown a lack of momentum in pushing the price upwards, leading traders and investors to wonder: Is this the right time to accumulate, or should caution prevail? Let’s dive into the technical analysis of ARB and explore what the chart is telling us about its future movement.
Key Support and Resistance Levels
The first step in understanding the next move for ARB is identifying the crucial support and resistance levels.
Support Levels:
- $0.52: This is the immediate support level that ARB is currently holding. A break below this could send ARB into further decline, potentially testing the $0.50 mark.
- $0.50: The psychological barrier that could act as a major support zone if the $0.52 level fails.
Resistance Levels:
- $0.54: This level, near the 25-period SMA, is providing resistance for ARB’s price action. Breaking above this could signal the beginning of a potential recovery.
- $0.56: The 99-period SMA is sitting at $0.56, making this a key resistance level that needs to be cleared for a sustained bullish movement.
Moving Averages: Bearish Trend Still Dominant
A quick look at the moving averages suggests that ARB is still in a bearish trend, but there may be signs of stabilization.
- The 7-period SMA is resting at $0.52, which ARB is currently trading slightly above. This short-term moving average has been acting as support, but for a clear breakout, ARB will need to push above $0.54, where the 25-period SMA resides.
- The 99-period SMA at $0.56 is the longer-term resistance level. It will act as a critical barrier, and until the price breaks above this, a sustained uptrend may be difficult to achieve.
This positioning of the moving averages indicates that ARB is still in a bearish trend, and any recovery will need to clear the $0.54 and $0.56 levels to gain upward momentum.
MACD: A Bullish Crossover on the Horizon?
The MACD (Moving Average Convergence Divergence) indicator shows some interesting developments for ARB.
- The MACD line is close to crossing the signal line, with current readings at -0.0002 and -0.0053, respectively. This hints at a possible bullish crossover, which could lead to an upward price movement.
- The MACD histogram is also showing signs of weakening bearish momentum. This is a signal that sellers are losing control, and buyers could start to push the price higher.
However, it’s important to note that the MACD hasn’t fully confirmed a reversal yet. Traders should keep an eye on this indicator in the coming hours to see if the bullish crossover materializes.
Volume Analysis: Low Volume Suggests Weak Buying Interest
One of the key factors holding ARB back is the relatively low trading volume. The Volume SMA (9) is currently at 936.055K, which indicates a lack of strong buying pressure.
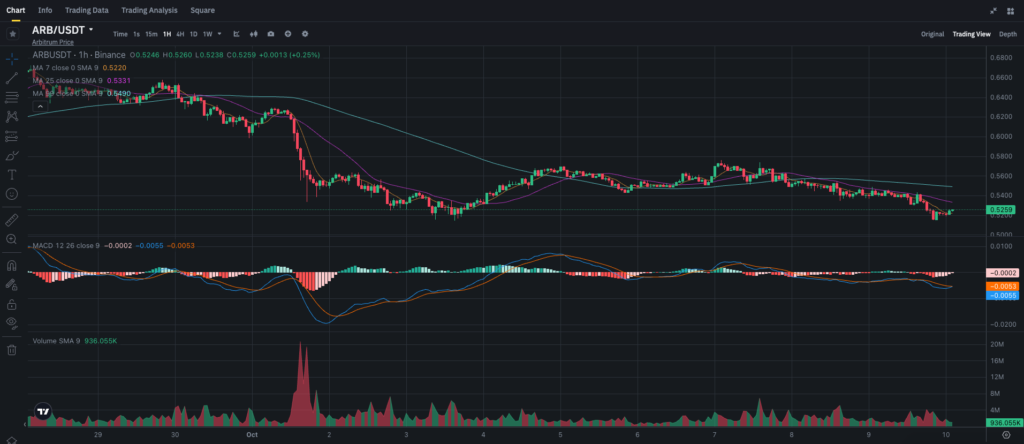
Low volume in a downtrend is typically a sign of weak buyer confidence, meaning that the price could continue to slide if buyers don’t step in soon. To see a solid recovery, ARB needs an increase in volume to support any potential bullish moves above the resistance levels of $0.54 and $0.56.
Market Sentiment and Recent Developments
Arbitrum remains a popular choice in the Layer 2 space, known for its efficient transaction scaling on Ethereum. However, like many tokens in the current market environment, ARB is facing external pressures, including macroeconomic uncertainty and overall market bearishness.
There hasn’t been any major Arbitrum-related news or updates that would act as a catalyst for price movement. Therefore, ARB’s price is largely following the broader crypto market sentiment, which has been shaky due to factors like regulatory concerns and Bitcoin’s ongoing price volatility.
Trading and Investment Strategies
For Short-term Traders:
- Range Trading: Traders can consider buying near the support at $0.52 and targeting the resistance around $0.54 for short-term gains. A stop-loss below $0.50 could help manage risk in case of further declines.
- Breakout Trading: If ARB breaks above $0.54 with strong volume, this could lead to a rally toward the $0.56 level. Watch for a breakout confirmation before entering a long position.
For Long-term Investors:
- Accumulation Strategy: Long-term believers in Arbitrum’s technology might view this current price level as a good opportunity to accumulate. The project’s long-term fundamentals remain strong, and any dips below $0.52 could provide a good entry point for accumulation.
- Hold Strategy: If you already hold ARB, it might be wise to wait for clearer signs of a trend reversal, such as a sustained move above $0.56, before considering selling. The current price action suggests that a major uptrend is not yet in play.
Conclusion: Can ARB Recover from Its Decline?
ARB is currently at a critical juncture. While the price is holding at the $0.52 support level, the lack of volume and overall bearish indicators suggest that caution is needed. A break above $0.54 could be the first sign of a potential recovery, but traders and investors should closely watch for a bullish MACD crossover and an increase in volume to confirm any upward momentum.
For those looking to make short-term trades, the range between $0.52 and $0.54 offers opportunities, while long-term investors may want to consider accumulating if the price dips further.
To stay updated on ARB and other cryptocurrencies, follow my blog on Binance Square and join my Telegram channel for real-time analysis and insights.

