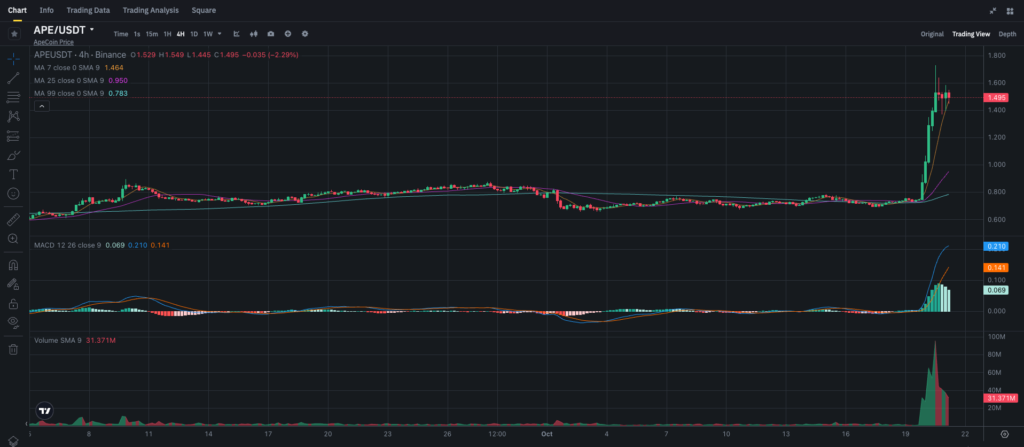
ApeCoin (APE) has experienced a significant breakout, rallying strongly over the last 48 hours. From hovering near $1.00, it surged to above $1.60 in a matter of hours, leaving many traders and investors curious about whether this rally can sustain itself or if a pullback is on the horizon. In this analysis, we’ll break down the technical indicators and explore potential scenarios for both short-term traders and long-term investors.
What’s Fueling the APE Rally?
ApeCoin has seen some renewed interest due to a combination of factors, including overall market recovery and possibly a boost in sentiment surrounding the broader crypto ecosystem. However, this sharp move seems largely driven by technical breakouts rather than significant fundamental shifts. This kind of explosive price action typically attracts both day traders and momentum investors, leading to heightened volatility.
Technical Analysis of APE
Key Support and Resistance Levels
- Resistance at $1.60: APE has met some selling pressure around the $1.60 mark. This level is crucial because it aligns with previous resistance areas and the current price range is testing this level. A breakout above $1.60 could send the price higher toward the next psychological level of $1.75.
- Support at $1.40: If APE fails to break the $1.60 resistance, a dip back toward $1.40 is possible. This level also corresponds with the 7-period SMA, providing immediate support for the coin.
- Major Support at $1.20: Should there be a deeper retracement, $1.20 would be a major support level to watch, anchored by the 99-period SMA. A drop to this zone could attract buyers looking for a lower entry.
Moving Averages: A Bullish Cross Signals Uptrend
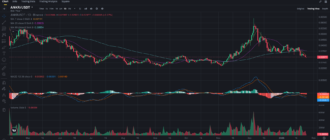
The 7-period SMA is currently positioned at 1.46, and the 25-period SMA at 0.95, both below the current price. This alignment suggests that short-term momentum remains strong and the price may continue to push upward. The 99-period SMA sits further down at 0.78, marking the long-term trend’s bullishness. These moving averages suggest that the overall trend for APE is positive, but short-term corrections are possible, especially if the price fails to hold above the $1.50 mark.
MACD: Bullish Momentum Still Strong
The MACD indicator is currently bullish, with the MACD line at 0.21 above the signal line at 0.14. The widening of the gap between these two lines is a sign of continued upward momentum. Additionally, the histogram is in positive territory, indicating that buyers are still in control. However, traders should watch for any signs of convergence between the MACD and signal lines, which could signal a slowdown in buying pressure.
Volume: Heavy Buy-Side Activity
The volume has spiked significantly during this rally, with the SMA 9 volume indicator at 31.37M, suggesting strong market participation. This increased volume, paired with a price rise, is typically a positive sign of sustained momentum. However, any abrupt drop in volume could indicate exhaustion and lead to a short-term pullback.
Trading Strategies for APE
Short-Term Traders:
- Look for a Breakout Above $1.60: If APE manages to break and sustain above $1.60, it could open the door for a rapid move toward $1.75 and possibly even $1.90. Momentum traders could consider entering on a confirmed breakout with a tight stop-loss near $1.50.
- Buy on Dip Near $1.40: For those looking for a lower entry, consider buying the dip near $1.40, which is supported by the 7-period SMA. If APE holds this level, it could present another opportunity for a move higher.
Long-Term Investors:
- Accumulate on Pullbacks to $1.20: Long-term investors may want to look for buying opportunities closer to the $1.20 support level. This zone offers a better risk-to-reward ratio for those aiming to hold through any short-term volatility.
- Hold for Larger Gains: Given the recent price surge, long-term holders might benefit from staying invested. If the bullish momentum continues, APE could test the $1.75 resistance and beyond, potentially delivering larger returns over the coming weeks or months.
Price Prediction for ApeCoin
Given the strong technical indicators, APE is likely to continue its upward trend in the short term, especially if it breaks above the $1.60 resistance level. If this level is breached, the next price targets could be $1.75 and $1.90. However, if APE fails to sustain the rally and breaks below $1.40, we could see a pullback toward $1.20, where long-term support lies.
If market conditions remain favorable, APE has the potential to reach $2.00 within the next few weeks. However, a lot will depend on broader market trends and whether the current rally can sustain the necessary momentum.
Conclusion: What’s Next for ApeCoin?
APE’s recent breakout has caught the attention of traders, and with good reason. The technical indicators suggest more upside potential, but traders should remain cautious of potential pullbacks. For short-term traders, watching the $1.60 resistance level will be crucial, while long-term investors might consider accumulating on dips toward $1.20.
Whether you’re in it for the quick gains or holding for the long haul, APE presents some intriguing opportunities right now. Keep an eye on the key support and resistance levels, and as always, manage your risk.
To stay updated on the latest market movements and analysis, follow my blog on Binance Square and join my Telegram channel for more detailed crypto insights and updates.


