AltLayer is an infrastructure-focused project that gained market attention during the surge of interest in modular and restaking-based solutions, only to face a prolonged cooldown afterward. Following an active trading phase, ALT entered a long corrective cycle marked by declining volatility and fading liquidity. As 2026 begins, ALT trades well below last year’s levels, making the 2026 price forecast highly dependent on whether the market can break out of its bearish structure. Current price action suggests a search for equilibrium after extended selling pressure.
ALT technical analysis: daily chart and trend structure
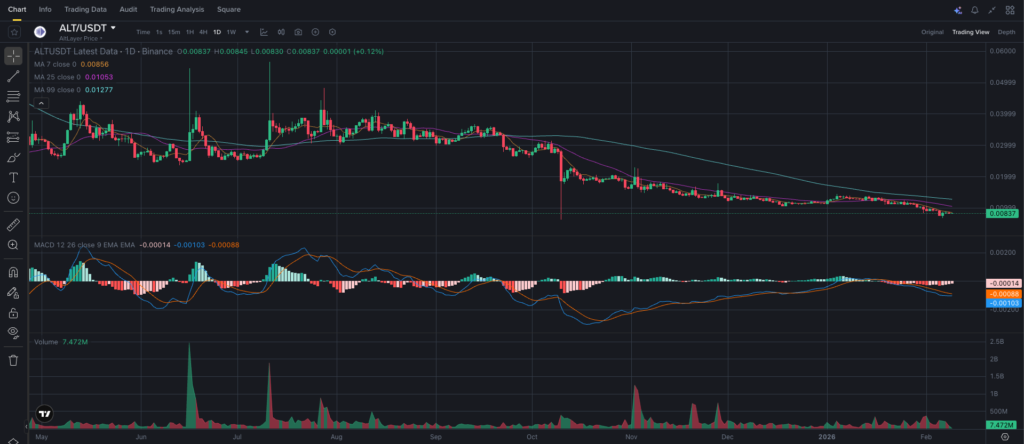
This analysis is based on the 1D timeframe. The latest completed candle is February 9, 2026, 02:00 UTC. On the daily chart, ALT remains in a bearish structure defined by lower highs and lower lows, formed after the mid-year peak.
After several consolidation phases, the market transitioned into a steady decline that intensified during the autumn. Recovery attempts failed to alter the broader structure, with each rebound producing a lower high. At this stage, price action appears compressed, a condition often seen in the later stages of downtrends.
ALT support and resistance levels
The primary support zone is located around $0.0080–0.0083, where price is consolidating in early 2026. This area has repeatedly absorbed downside pressure, highlighting its technical relevance.
If this support breaks, the next downside reference sits near $0.0065–0.0070, aligning with deeper historical demand. On the upside, immediate resistance appears around $0.0105–0.0110, followed by a stronger supply zone at $0.0125–0.0130, where long-term dynamic resistance converges.
Moving averages and market structure
The chart uses MA 7, MA 25, and MA 99. Short- and mid-term averages remain below the long-term MA(99), and all slopes are still negative. This alignment reflects continued bearish control in the medium term.
Short-term bullish crosses have occurred, but without volume confirmation they quickly faded. A structural shift would require sustained price action above MA(99) and a clear change in its slope.
MACD and volume analysis
MACD remains below the zero line, with the MACD line under the signal line. The histogram shows modest negative values that are gradually flattening, suggesting weakening downside momentum rather than a confirmed reversal.
Volume has declined significantly compared to mid-year activity. Recent sessions show steady but subdued trading, typical of accumulation phases or periods of anticipation ahead of new catalysts.
Short-term outlook for ALT
If price holds above the $0.0080–0.0083 area, ALT could continue ranging with attempts to test $0.0105. This would resemble consolidation following an extended decline. A decisive breakdown would increase the probability of a move toward $0.0065–0.0070. As long as price remains below key resistance, upside moves appear technical in nature.
ALT price prediction for 2026: scenario outlook
The base-case scenario for 2026 places ALT within a $0.015–0.022 range. This outcome becomes more likely if infrastructure narratives regain traction and price reclaims long-term resistance levels.
A more bullish scenario allows for expansion into the $0.030–0.040 zone, contingent on sustained trend reversal, rising volumes, and ecosystem-driven catalysts.
The bearish alternative scenario envisions continued pressure and price action within $0.005–0.007, should current support fail and broader market conditions remain weak.
Additional factors influencing ALT’s price
In recent months, market attention has focused on restaking solutions and scaling infrastructure. For ALT, protocol upgrades, partnerships, and ecosystem development remain key variables.
Macro conditions, regulatory developments, and competition among infrastructure projects also influence sentiment. Any developments capable of reviving interest in the sector could act as short-term catalysts.
Trading vs investing: how participants may approach ALT
ALT currently trades within a prolonged downtrend showing early signs of stabilization. Volatility has declined, and momentum remains muted.
Short-term traders often monitor reactions at major support and resistance zones, paying attention to false breakouts and volume behavior.
Long-term investors may view 2026 as a potential recovery horizon, spacing exposure over time while waiting for structural confirmation.
Final thoughts on ALT in 2026
AltLayer enters 2026 after an extended correction and reduced market attention. While the technical picture remains cautiously bearish, stabilization signals are beginning to emerge. Any recovery will depend on broader infrastructure-sector sentiment and ALT’s ability to reclaim key resistance levels. Under supportive conditions, upside scenarios remain plausible, though downside risks persist. ALT is available on major exchanges including Binance , Bybit, and HTX.