Chart Overview and Current Market Context
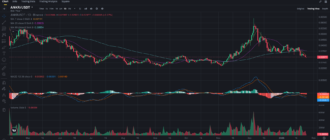
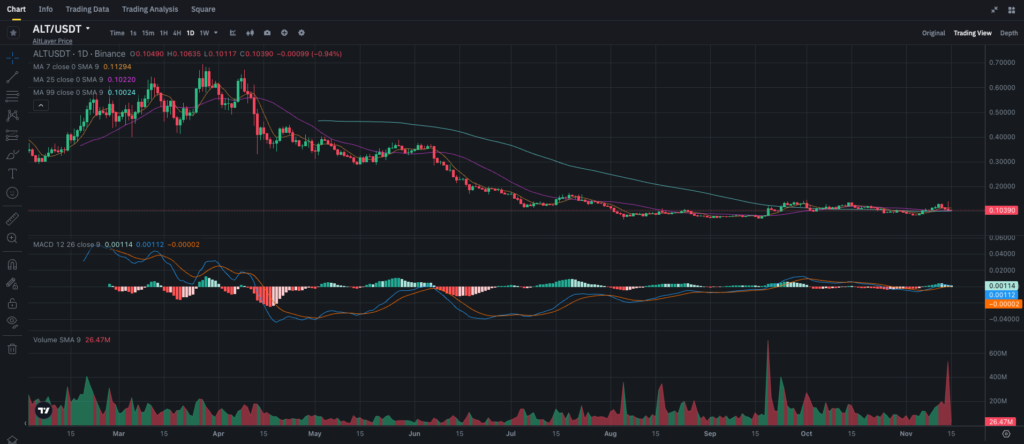
The daily chart for ALT reveals a substantial downtrend throughout the year, with the price currently trading around $0.1039. ALT has struggled to maintain upward momentum after a series of lower highs and lower lows since April. The price has been in a phase of consolidation in recent months, showing limited volatility. Let’s dive into the technical indicators and key levels to assess whether ALT might be positioned for a reversal or if further declines are likely.
Key Support and Resistance Levels
Understanding critical support and resistance levels is essential for gauging potential price movements:
- Immediate Support: $0.10 – This psychological level has provided a temporary floor for the price, serving as key support for the ongoing consolidation.
- Major Support: $0.08 – If the price fails to hold $0.10, a drop to $0.08 could be on the horizon, signaling continued bearish sentiment.
- Immediate Resistance: $0.112 – This level aligns with the 7-day moving average and recent price highs, presenting an immediate obstacle for bullish movement.
- Major Resistance: $0.125 – This is a more substantial resistance level that, if broken, could signify a shift in the trend and attract more buyers.
With these levels outlined, let’s examine how the technical indicators and moving averages further inform the analysis.
Moving Averages (MA) Analysis
The moving averages provide a snapshot of the overall trend and potential support or resistance levels.
- 7-day MA (Short-Term): The 7-day moving average, currently around $0.112, lies above the price, suggesting immediate short-term bearish pressure. For any sustainable bullish trend to emerge, ALT would need to break above this level.
- 25-day MA (Medium-Term): Positioned at $0.1022, the 25-day moving average is acting as short-term support. ALT’s ability to hold above this moving average will be crucial to avoid further declines.
- 99-day MA (Long-Term): The long-term 99-day moving average is at $0.1002. ALT would need to hold above this moving average to signal any real potential for a trend shift. A sustained break above the 99-day MA could indicate that the bearish cycle might be coming to an end.
Given the close alignment of the price with the 25-day and 99-day moving averages, ALT’s immediate trend appears to be neutral to bearish. The price is below the 7-day moving average, which indicates short-term bearish pressure, but if ALT holds above the 99-day MA, it could provide a foundation for eventual upward movement.
MACD Analysis
The MACD (Moving Average Convergence Divergence) is a valuable tool for assessing momentum and potential trend reversals.
- MACD Line: The MACD line is close to the Signal line, indicating limited momentum in either direction. This reflects the low volatility in ALT’s price action over the past few months and a lack of clear bullish or bearish pressure.
- Histogram: The histogram shows small and almost flat bars, suggesting a weak trend and potential sideways movement. This confirms the lack of strong momentum in the current price range.
With the MACD showing little momentum, the market seems to be in a wait-and-see phase, with traders awaiting clear signals before committing to new positions. If the MACD line crosses above the Signal line with increased histogram bars, it could signal a shift to bullish momentum.
External Factors Impacting ALT’s Price
Altcoin Market Sentiment
ALT, like most altcoins, is heavily influenced by the broader market sentiment. Currently, the altcoin market is marked by cautious optimism, but many traders are still hesitant due to the overall crypto market volatility. Any major altcoin rally, particularly with significant coins like Ethereum or Bitcoin experiencing upward movement, could create favorable conditions for a potential ALT breakout.
Project Developments
News or updates from the ALT development team, partnerships, or technological advancements can also affect the price. If the project has new releases or partnerships in the pipeline, it could attract fresh interest and provide additional upward momentum. However, a lack of updates could keep the price constrained to its current range.
Price Forecast and Scenarios for ALT
Based on the current technical analysis, ALT’s price could follow several paths in the coming weeks:
- Bullish Scenario: If ALT manages to break above the $0.112 resistance level and sustain this move, it could trigger a rally toward $0.125. This scenario would require increased volume and a shift in momentum, as indicated by the MACD crossing over into positive territory.
- Neutral/Consolidation Scenario: If ALT continues to range between $0.10 and $0.112, it could signal consolidation. This phase would likely indicate that traders are waiting for stronger cues before committing to a bullish or bearish position. In this scenario, volume and MACD signals should be closely monitored for potential breakout signs.
- Bearish Scenario: If the price fails to hold the $0.10 support and declines further, ALT could retest the $0.08 support level. A breakdown below $0.08 would likely confirm a continued bearish trend, potentially leading to more selling pressure and lower lows.
Trading and Investment Insights
For Short-Term Traders
Short-term traders may consider opening a position if ALT breaks above the $0.112 resistance level with strong volume. A stop-loss slightly below $0.10 would help manage risk if the price reverses. Potential profit targets could be set near $0.125, where resistance may re-emerge.
If ALT struggles to break above $0.112, short-term traders may want to wait for clearer signs of a breakout to avoid potential losses in a sideways or declining market.
For Long-Term Investors
Long-term investors might see value in accumulating ALT if the price holds above the 99-day moving average at $0.10. If ALT sustains its position above this level, it may signal that the bearish trend is stabilizing. Dips toward $0.08 could provide additional accumulation opportunities for those willing to hold during the market’s downcycle, with potential long-term rewards as the trend reverses.
Conclusion
ALT currently faces a neutral to bearish outlook with key support at $0.10 and immediate resistance at $0.112. The MACD’s low momentum and the price’s close alignment with critical moving averages suggest a consolidating market with potential for a breakout in either direction. ALT’s future movement will depend on broader market conditions and any project-specific developments that could attract fresh interest.
ALT is available for trading on Binance in a USDT pairing, making it accessible for both short-term and long-term participants.

